Charting a Course on the Courts
Kirk Goldsberry, NBA analyst and San Antonio Spurs researcher, joins McCombs to show students how analytics is changing the game.
By Jeremy M. Simon

As a teenager growing up in Pennsylvania, Kirk Goldsberry loved to spend time playing basketball at the neighborhood park. His favorite shot: from the left side of the court, where he would fake a spin move and then turn the opposite direction, hitting a fade away off the backboard.
Goldsberry tried to get the shot down from the right side of court — but he never could make it as reliably. Then, watching the pros on TV, he noticed star players also had their favorite side of the court — often the left. “I’m a terrible basketball player, but it didn’t stop me from playing for years,” he says. “As a kid, I knew that I was better on one side of the basketball court, and that even NBA players had asymmetries in their abilities.”
It’s an insight Goldsberry kept filed away for years.
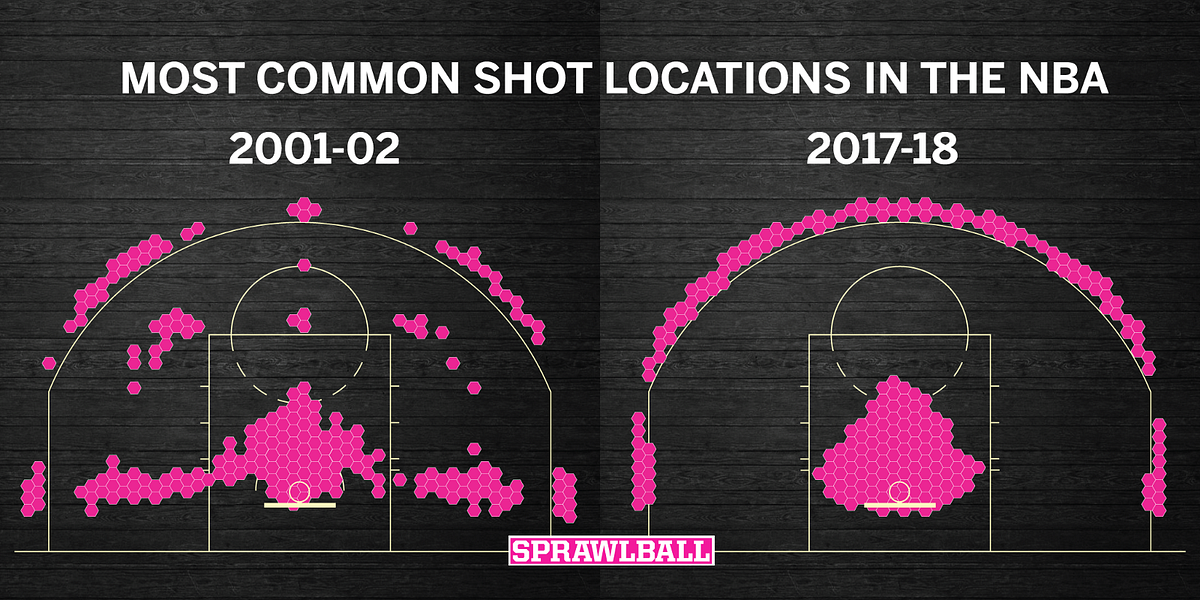
Today he can back up his youthful insight with hard data, having staked out a one-of-a-kind career in sports analytics. An early love of maps and cartography led him to overlay visualizations onto a basketball court, and his pioneering hexagonal shot chart led to jobs as vice president of strategic research at the San Antonio Spurs and NBA analyst at ESPN.
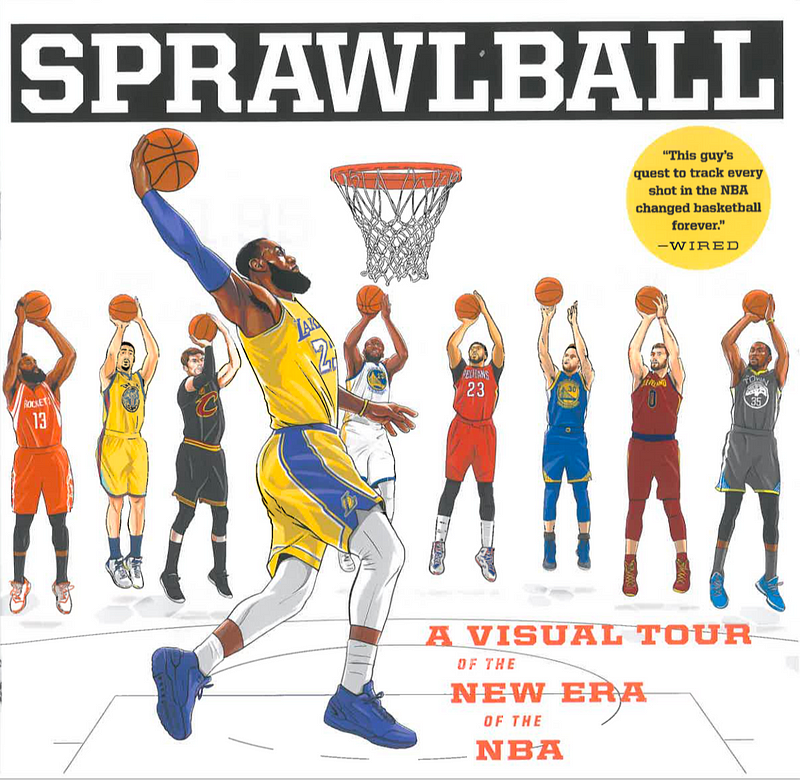
This April, he published a new book, SprawlBall: A Visual Tour of the New Era of the NBA. Analytics guru Nate Silver wrote of the book: “If you want to understand how the modern NBA came to be, you’ll need to read this book.” Wired magazine said: “This guy’s quest to track every shot in the NBA changed basketball forever.”
This spring Goldsberry joined the McCombs faculty. We sat down with him to learn about how he’s made a career mapping data on the basketball court, along with the business lessons he believes sports analytics can impart.
You’ve been drawn to mapmaking since your undergraduate studies at Penn State and first job as a cartographer at FEMA. How did you figure out that maps could be applied to sports?
Often the best way to communicate spatial information is a map. I’ve borrowed a lot of the best mapping techniques and ideas from my background in geography. That’s really propelled my work. I spent my entire 20s learning how to make maps and communicate spatial data in ways that had nothing to do with sports.
Academically, I’m most happy and comfortable at the intersection between computer mapmaking and leveraging this century’s emerging technologies. In 2011, as a visiting professor at Harvard, I started to blend my other love, which is basketball, with mapmaking and visualization. I visualized individual players’ shooting tendencies on the basketball court as a new kind of sports analytics.
It all started with applying a fundamental lesson from one domain to another. That was a breakthrough for the field. People ask, “How does a geographer become a sports analytics person?” Location, location, location. It’s all about space. Basketball is a spatial sport; space influences everything that happens in every game. Until very recently, that was entirely overlooked in basketball stats.
Basketball shot charts ask, “Where does this player shoot from? And how well does he shoot from there?” The best answer is a graphic. Constantly balancing that spatial and visual framework in sports has been my calling card.
Why did it take other people so long to catch on?
As obsessed as we are with sports, nobody was talking about space, with the exception of things like three-point range. I knew we could get a lot more precise.
But it wasn’t until this decade that you could put the data into a computer. When I first presented this at the MIT Sports Analytics Conference in 2012, nobody had given it this treatment. That says the real bottleneck in sports analytics is not often technology but intellectual in nature: trying and applying things from different fields.
After presenting your research at that conference, you landed a coveted role working for sports writing guru Bill Simmons. How did that happen?
That paper went viral. Then I provided an NBA finals preview for The New York Times, which was seen by millions of people. A few weeks later, Bill Simmons asked me to work at Grantland. I was a big fan of that website. I remember seeing his email and feeling, “Wow, this is awesome.” When your favorite writer says, “Will you come write with me?” that’s pretty cool. So I leapt at the chance.
I did that part-time while I was teaching at Harvard. After the first year, more people were enjoying my work, and I got a full-time offer to go work at ESPN in 2013.
And you kept going: After working at ESPN, you became the vice president of strategic research for the San Antonio Spurs.
When I was at ESPN and Harvard, the Spurs took a great interest in my research. I developed a friendship with R.C. Buford, their general manager. At some point in 2015, he asked me to come work there.
I never wanted to work for a team, but the Spurs are the one team I really was drawn to. I lived in Austin and the Spurs are the best organization in sports. When they ask you to join them, you do it. I had the chance to bask in that culture and learn from Coach Gregg Popovich, R.C., and the great players — like Tim Duncan and Manu Ginobili, who were still there — and be a part of that championship culture.
During your three years at the Spurs, how did you use analytics to improve the team?
We applied analytics heavily to the draft: How can we use statistical modeling to understand which amateur players are most — or least — likely to succeed? And how can that influence our choice on draft night? For free agency evaluation, we were looking at which players were a good fit for our team and why, and how much we should pay them.
We used analytics for our team’s on-court strategy or understanding our opponents’ weaknesses and strengths. And looking at all of the performance data on player health, wellness, and athletic performance. There are increasingly giant haystacks of data about athletes, and we were trying to find the needles in those haystacks.
Can you name any specific players selected using your approach?
Bryn Forbes was undrafted in college, but my shooting analytics identified him as a very good NBA shooter. We did an advanced dive into his shooting statistics at Michigan State University and saw some things that we really liked. When we had him in our workout environment, our shooting coach also noticed. Most undrafted players don’t even make the NBA. He’s playing tons of minutes for the Spurs now and is one of the league leaders in three-point percentage. It was a really cool example of analytics highlighting something that a coach may have seen but may not have thought about twice. Now, he’s making millions of dollars playing basketball.
You’re bringing what you’ve learned into the classroom with your MBA class, Performance and Sports Analytics. What are students learning?
The first is obviously sports analytics, the quantitative revolution, and how we’re characterizing performance in the games we love to watch. On a secondary level, sports is obsessed with ways to quantify and understand performance in ways that almost anybody can apply to whatever field they work in.
Sports capture the hearts and passions of young learners in ways that very few other domains can. That said, I don’t think it’s an academic subject unto itself.
Besides analytics, what can your students expect to learn?
We’re emphasizing storytelling. One of the most underrated aspects of analytics is communicating your findings — not just dumping numbers on somebody, but telling a story. That’s really the hardest part.
How do I tell Coach Popovich something? That’s different from how I would tell a business school audience or a television audience the same thing. The greatest writers and filmmakers have shown us what works: What can we learn from them? Every MBA student today needs to be able to handle data and tell a story. I don’t think that’s being taught well enough in universities.
As a storyteller yourself, your book SprawlBall came out in April. What’s it about?
The NBA has changed in the analytics era. The book talks about some of the driving forces of those changes and some players who both embody and have been affected by those changes. We have chapters on Stephen Curry, LeBron James, and James Harden.
And you believe analytics can improve the game.
We can actually leverage analytics — not at the team level, but at the league level — to tweak aesthetics: What rules would optimize aspects we love while minimizing those we think are less interesting?
As opposed to how it’s been framed since Moneyball came out, with teams using analytics to beat other teams or rate players, there’s an opportunity to regulate and legislate a game, optimizing its beauty.
If you could change the NBA, what’s first on your list?
The most prominent one is where the three-point line should be, and we should use data to inform that. In 1961, Abe Saperstein, who’s most famous for founding the Harlem Globetrotters, drew a three-point line on a basketball court. That’s still where the three-point line is today.
When he first drew the line, nobody could shoot out there. It took two or three generations of players and coaches to take this from a circus shot to the core strategy of the NBA half-court offense. Now, the shot is too easy for most NBA players. We can look at moving the line back, adjusting the line, or enabling goal tending on three-point shots.
If we look beyond the court, how can we apply analytics in other areas?
People around the world know about batting average or points per game. We use those numbers to evaluate performance. This is not new or unique to sports, but the passion people bring to sports analytics is unique. You take the ability to quantify a performance and you ask how can we spread that to work at a stock brokerage — how are you evaluating your stock performance and your employees’ performance?
These concepts are important every day in every industry. By studying what has changed in sports, we can start to understand some concepts that are affecting all industries in the early 21st century.
What about here at UT Austin?
When it comes to sports, there’s no university in the world where I’d rather be thinking about this. UT is uniquely positioned with its size and passion to blossom into this hub for sports academic work. If there’s such a thing as a perfect university setting for sports analytics, it would be hard to argue that this isn’t the No. 1 place.
This article appeared in the spring 2019 issue of McCombs magazine. Click on the link to see the full issue.